JavaScript Console - Deep Dive
JavaScript developers use console on daily basis. Nonetheless, a lot of them use only basic methods like log, debug and error. Console has a lot of functionalities besides those - their appropriate usage can help us debug faster and more effectively. In this article I want to dive deep into console and explore it’s abilities.
About console and window.console
Console in JavaScript is accessible via console or window.console object. Using console object is safer in multi-environment codebase. In a browser environment, console is the global variable and it refers to window.console object. In a non-browser environments it’s not always true. For example, node.js uses global object instead of window. In environments where window is not defined, window.console will fail where console.log wouldn’t (provided the environment provides a global console object).
Basic logging with log
console.log() is the most used method of console. It outputs provided message to the browser's console. The message may be a string, an object or more than one JavaScript objects.
Examples:
console.log('test');
const testObject = { a: 1, b: 2, c: 3 };
console.log(testObject);
Logging objects
Using console.log(obj) is totally fine - if you want to check value of an object now. If you would like to log current state of an object to refer to it later, you may encounter some strange behaviour. Many browsers provide live view that constantly updates as variable values change, so after expanding logged object in the browser console, you may see current state of this object, not the state at the moment of logging it. For simple objects we could just avoid expanding them, but it's not really possible when working with complex objects. Let's see how it works:
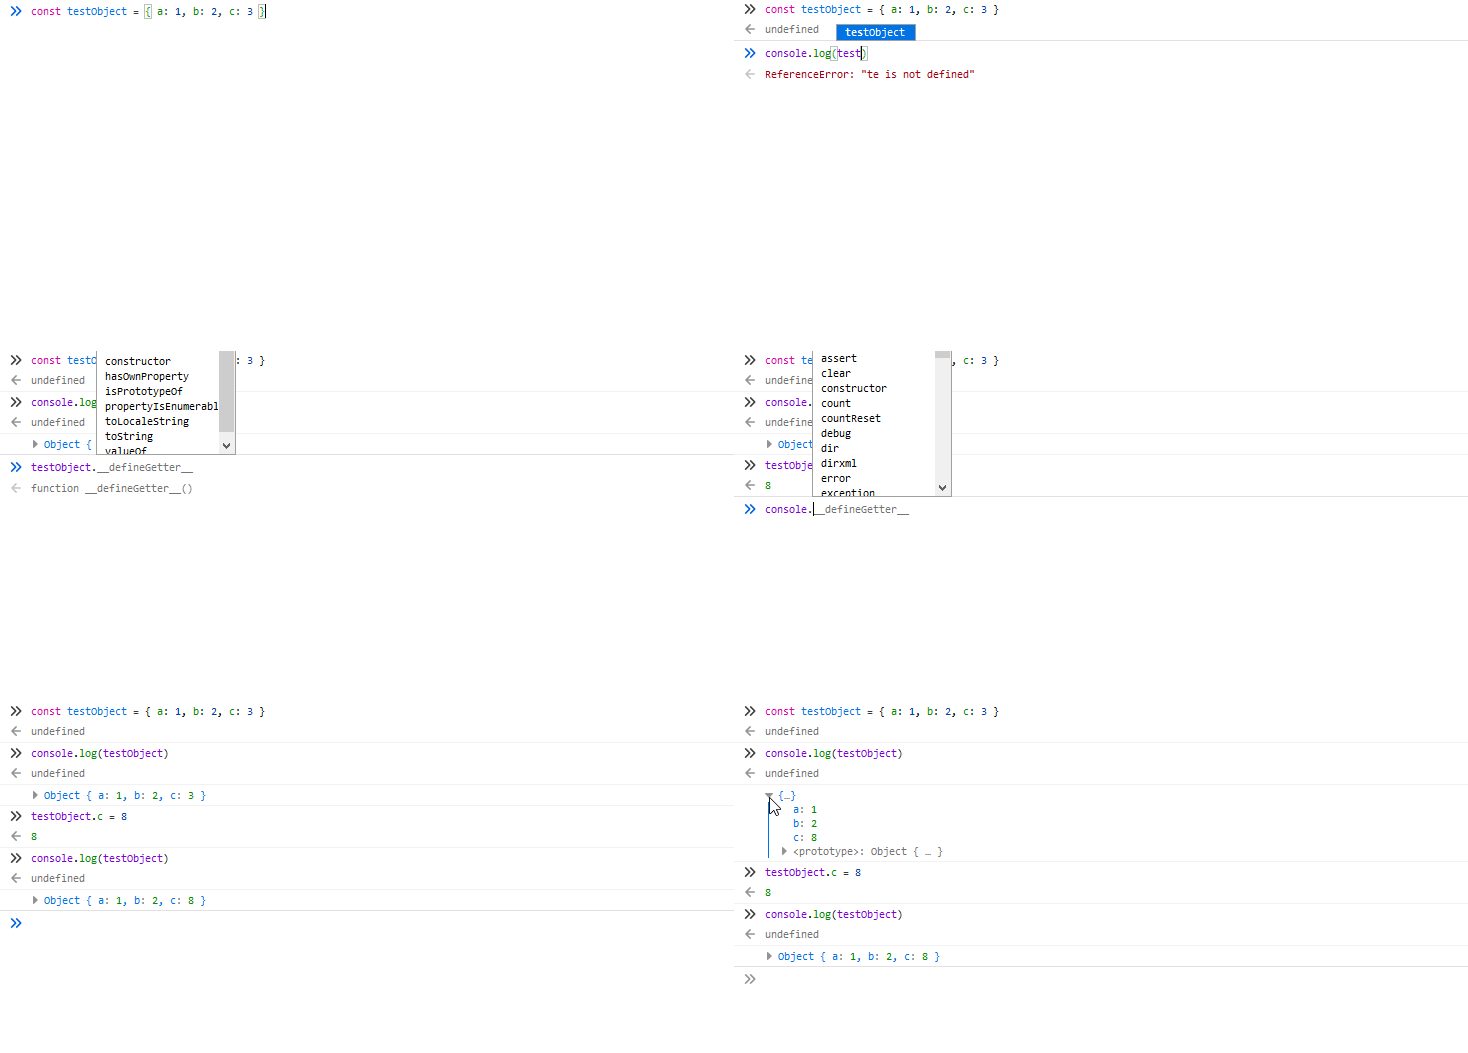
As we can see, before I expanded logged object, c value was 3, as it was at the time of logging it. But after expanding logged object, browser reloaded values using current state of variable and c changed to current value. It's probably not what you would want to see when referring to object logged at the past, so let's fix this. To see state of the object at the moment you log it, you must pass copy of the object to console. To do this, you can use JSON.parse and JSON.stringify:
console.log(JSON.parse(JSON.stringify(obj)));
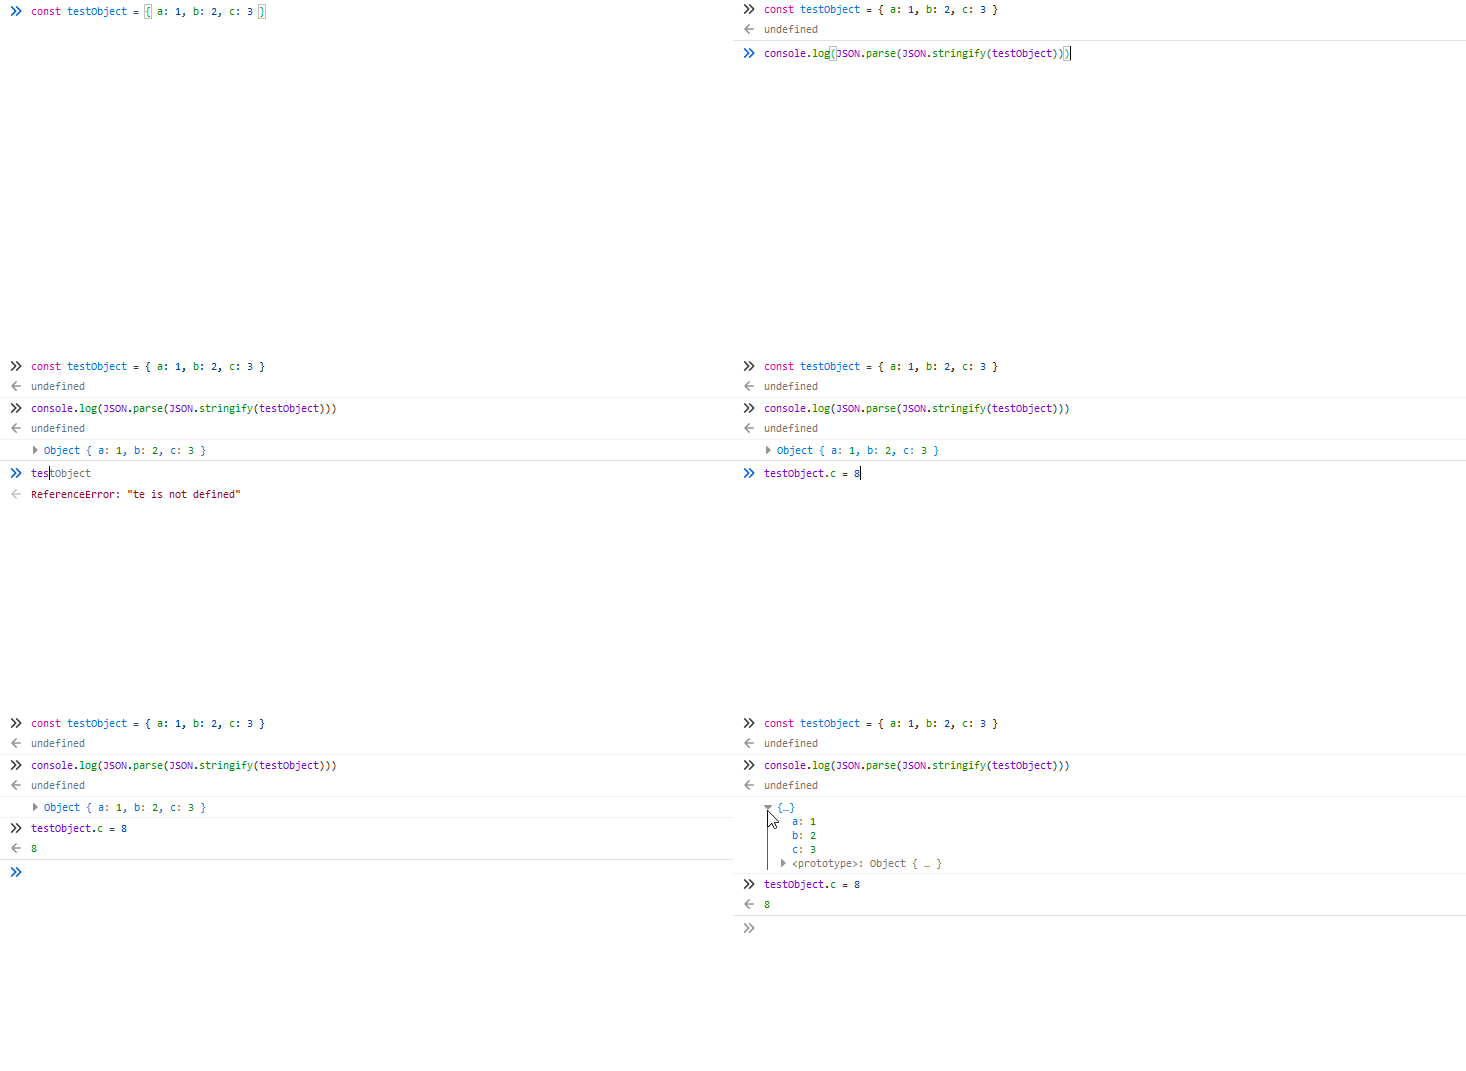
After expanding we can see the values we are interested in.
Logging HTML elements with dir
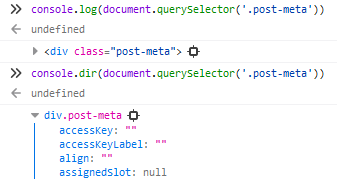
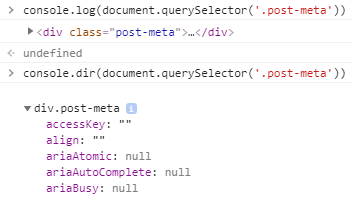
You can log HTML elements using log objects, but it prints the element in an HTML-like tree. If you want to print it in JSON-like tree use dir.
Firefox console example:
Chrome console example:
String substitutions
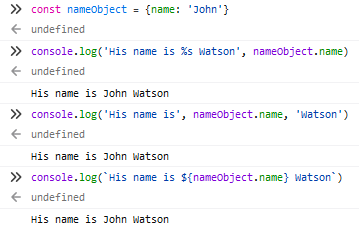
When passing a string to one of the console methods that accepts a string, you can use substitution strings.
To log a string, you can use %s:
const nameObject = { name: 'John' };
console.log('His name is %s Watson', nameObject.name);

This is equivalent to
console.log('His name is', nameObject.name, 'Watson');
console.log(`His name is ${nameObject.name} Watson`);
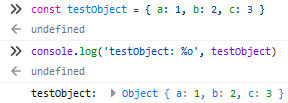
To log an object use %o or %O.
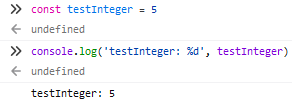
Using %d or %i allows us to log an integer.
Logging floating-point values requires %f.
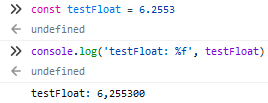
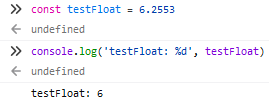
If you try to use %d with floating-point value, decimals are omitted.
Log levels - info, warn and error
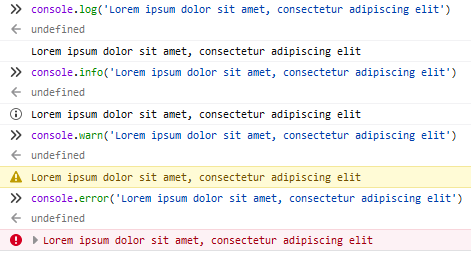
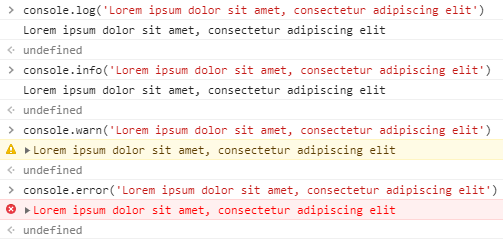
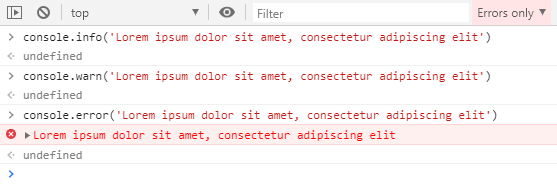
info, warn and error methods are similar to log - only differences are in message presentation. log and info messages are usually displayed without any special indicators. warn and error messages are visually differentiated, they have different styling and stack trace output.
Firefox console example:
Chrome console example:
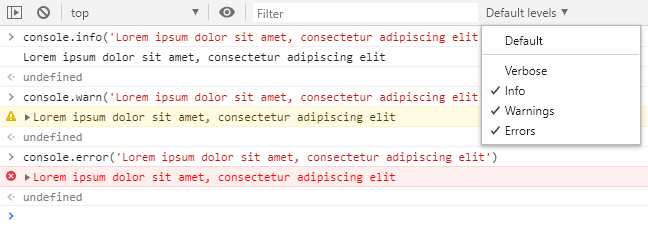
Huge benefit of using warn and error is ability to filter out less important messages using browser’s console filtering capabilities. Let's have a look at log level filtering in Google Chrome console:
Browsing tabular data with table
One of the most useful tools in JavaScript console is the table method. It allows for clear and readable data presentation, usually much better than raw object. You can use it to present arrays and objects.
const person = { name: 'John', lastName: 'Watson' };
console.table(person);

Not really useful for this simple object. But let's have a look at an array:
const arr = ['John', 'Sherlock'];
console.table(arr);

and an array of objects:
const data = [
  { name: 'John', lastName: 'Watson' },
  { name: 'Sherlock', lastName: 'Holmes' },
];
console.table(data);

With data getting more complex, table starts to show it's usefulness.
Sorting columns
Some browsers allow us to sort table columns. You can do this by clicking at the column name.

Filtering data
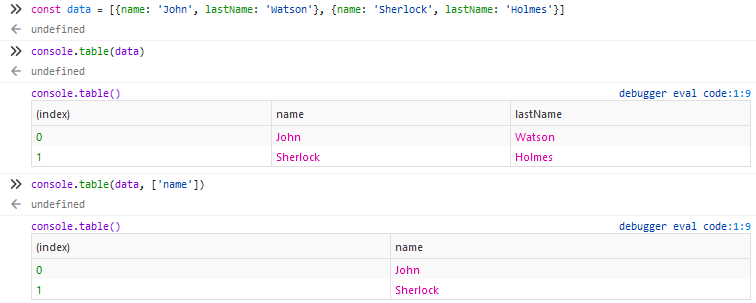
Sometimes objects can be very complex. If you want to present only essential data in our table you can use filtering. Just pass an array of desired properties to table:
console.table(obj, ['first', 'second']);
For example:
const data = [
  { name: 'John', lastName: 'Watson' },
  { name: 'Sherlock', lastName: 'Holmes' },
];
console.table(data);
console.table(data, ['name']);
Counting iterations with count
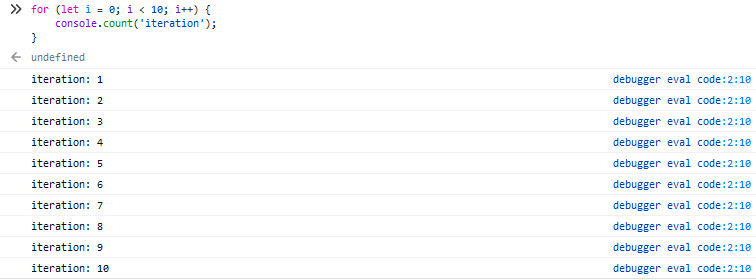
This method logs the number of times it has been called with specific parameter. For example:
for (let i = 0; i < 10; i++) {
  console.count('iteration');
}
Measuring time using time
I’ve seen many times measuring script execution time like this:
const start = new Date().getTime();
// ...
const end = new Date().getTime() - start;
then computing miliseconds. It’s neither handy nor quick, but again - JavaScript console comes in handy! time is a dedicated function to track execution time. Just give it a unique name, for example:
console.time('test');
// ...
console.timeEnd('test');
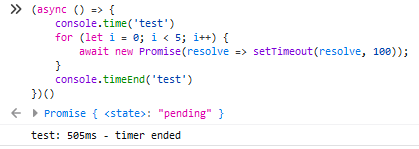
You can have multiple timers up and running at once. According to MDN - up to 10000, but I have tested it and managed to create 100000 timers on Chrome on macOS, while page still worked smoothly.
Grouping data with group
In my opinion this is incredibly useful feature. Many times I have seen applications logging tons of information, but it was very hard to find something in this clutter. Clever usage of this method could help us with this issue - grouping related data is a true game changer in terms of console readability. Let's take a look at this simple example:
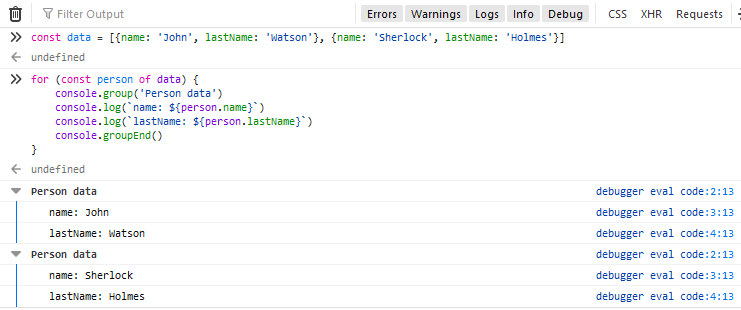
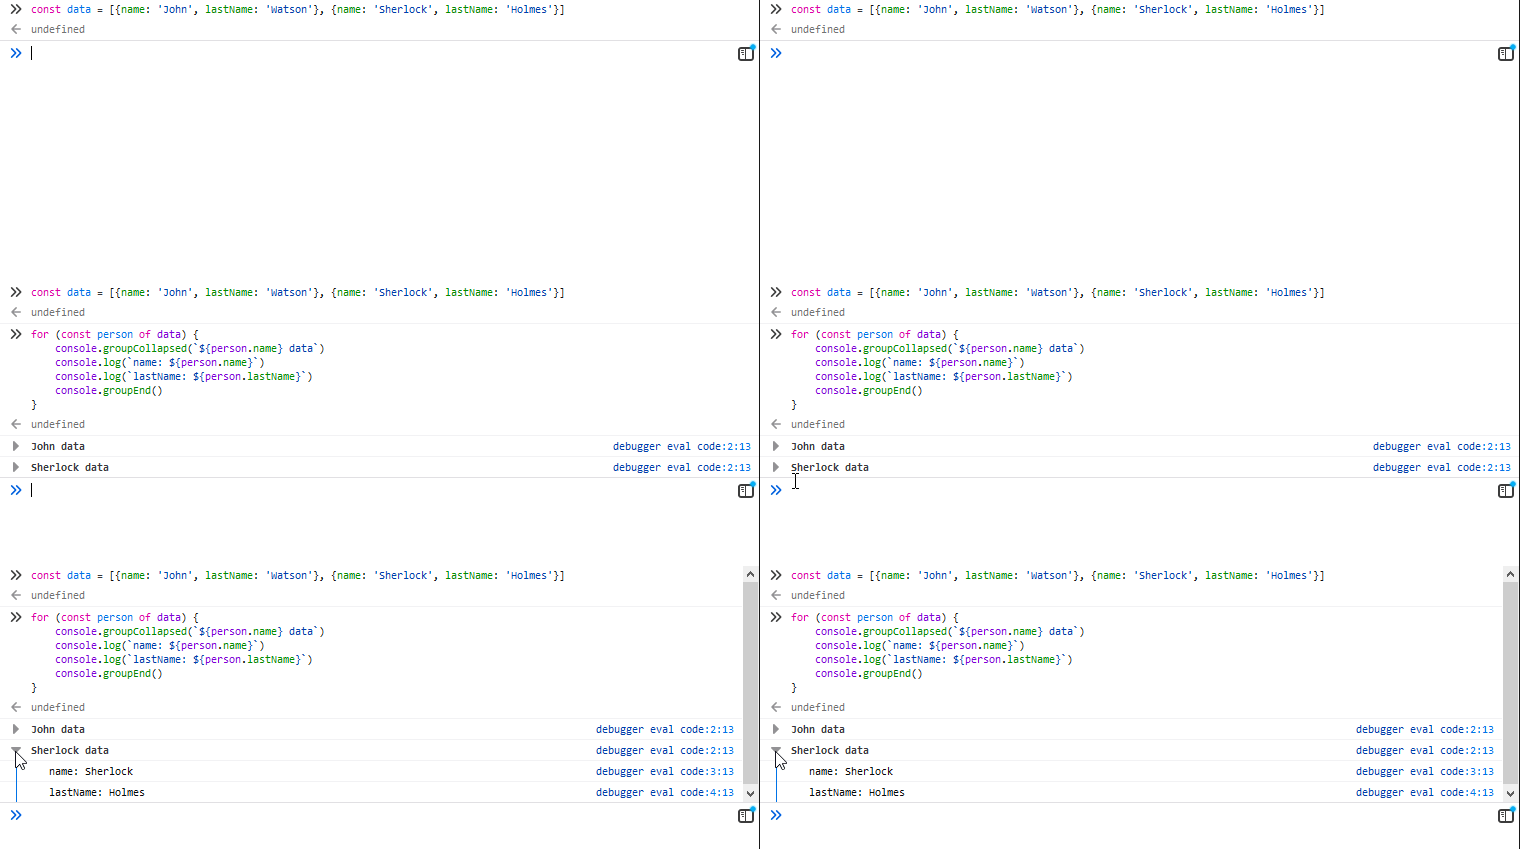
You can also use groupCollapsed to log initially collapsed groups:
trace
If you want to know where the log is being prompted from you can use trace() method. For example, if you call this method from inside of Angular you can expect output like below.
handleBlur($event: FocusEvent) {
  console.trace();
  // ...
}

If you call it in browser console, you will see it shows only one, (anonymous) step.

Styling console output with custom CSS
You can pass CSS properties to console.log() and other console methods. Input parameter with %c in the beginning allows us to inject CSS as a second parameter to log() method. For example:
console.log('%ctest', 'color: red; font-size: 30px;');

You can also pass different CSS properties for part of the text with multiple %c:
console.log(
  '%ctest%ctest',
  'color: red; font-size: 30px;',
  'color: blue; font-size: 20px;'
);

Passing %c in the middle of the string will apply styles to text after this directive:
console.log('not applied %c applied', 'color: red; font-size: 30px;');

Examining memory usage with memory in Chrome
In Google Chrome you can use memory to examinine current heap size status.
console.memory;

It is equivalent to window.performance.memory object.
Checking assertions with assert
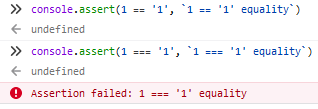
The assert method writes an error message to the console if the assertion is false.
console.assert(assertion, message);
Clearing console output using clear
clear allows to clear the console if the environment allows it.
clear();